Performance Monitoring
Understand and optimize CMS performance with data from every layer of the technology stack at your fingertips.
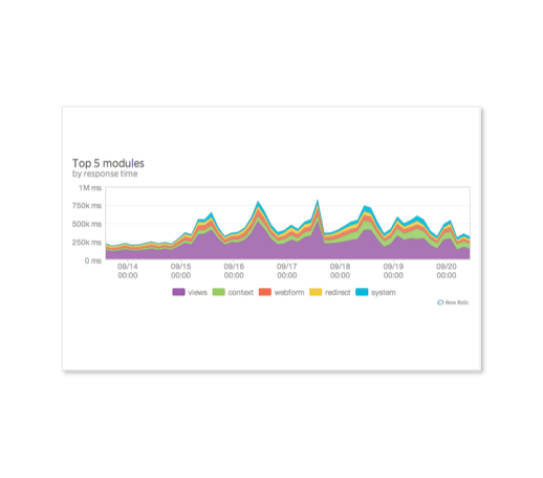
Monitor performance with New Relic APM Pro
New Relic APM Pro gives developers and IT administrators the information they need to understand and dig into performance issues. Every Acquia Cloud Platform customer has access to a New Relic APM Pro subscription for their applications.


Monitor performance with Stack Metrics
View metrics like cron memory usage, varnish cache hit rates, and more to understand your application's performance, health, and resource utilization during traffic spikes and after deployments in current and historical graphs.
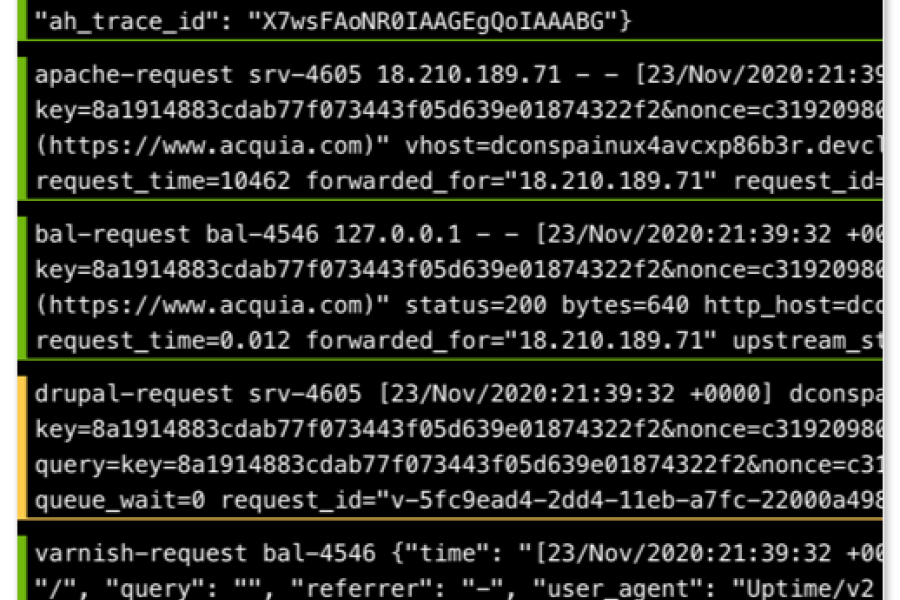
Stream logs in the Cloud Platform UI
Gather information from various logs quickly and easily. Dig deeper into the data by pausing the log stream, downloading logs for further inspection, or leverage Acquia's Log Forwarding add-on to forward logs to internal or third party recipients.


Be the first to know if something's wrong.
Or, if you want, the second. Get a complete view of your application’s performance so you can monitor it yourself, or take advantage of 24/7 monitoring and support. Plus, with email/SMS alerts, if something goes wrong, you’ll know right away.

more about ACMS
An out-of-the box version of Drupal with enhanced capabilities you won't find anywhere else. All maintained by Acquia.
related feature: Enterprise Caching
Scale delivery of personalized experiences to billions of views. With a built-in CDN and best-in-class infrastructure from Varnish to Memcache to BigPipe, Acquia reinvents CMS run-time architectures with caching at all layers of the digital stack.
