

Senior Product Marketing Manager Product Marketing Acquia
Collection
5 Signs Your CMS Is Costing You More Than You Think
Collection :
The true cost of your CMS is probably higher than anyone in your organization has calculated. That isn’t because someone miscounted; it’s because the most expensive CMS maintenance costs never make it onto a balance sheet at all.
The license fee is a line item. The hosting bill is a line item. But the developer sprints consumed by security patches, the campaigns delayed by a ticket queue, and the brand exposure from a microsite nobody owns don't show up anywhere. They compound quietly, quarter after quarter, until what looked like a manageable infrastructure decision has become a strategic liability.
What follows are five organizational symptoms that point to a platform problem worth quantifying. Each one ends with a diagnostic question you can bring into a conversation with your engineering or marketing counterpart today. And if more than two of these sound familiar, you're paying a maintenance tax you haven't fully calculated yet.
Are your developers maintaining your CMS or building on top of it?
There's a version of a web team that spends most of its time shipping new experiences: personalization experiments, campaign microsites, performance improvements and new integrations. And then there's the version most enterprise organizations actually have: a team that spends a significant portion of every sprint on plugin updates, security patches, infrastructure management, and content request tickets from marketing.
Both teams are busy. Only one is building. The difference shows up in developer experience long before it shows up in a budget review: teams trapped in maintenance cycles report lower retention, slower onboarding, and a growing backlog of deferred product work that compounds with every sprint.
The cost isn't just the hours themselves. It's the opportunity cost of developer capacity consumed by maintenance rather than innovation, e.g., features that don't get built, experiments that don't get run, and technical debt that accumulates because the team is too busy keeping the lights on to address root causes. With developers spending nearly a quarter (23%) of their time maintaining the CMS and similar tasks, it’s easy to see how innovation capacity quietly drains away before developers can write a single line of product code.
Diagnostic question: What percentage of your web team's time last quarter went to CMS maintenance versus building new experiences?
Does your marketing team need a developer to launch a campaign?
If a marketer needs to file a ticket to update a hero banner, the problem isn't the marketer's technical skills. It's the architecture.
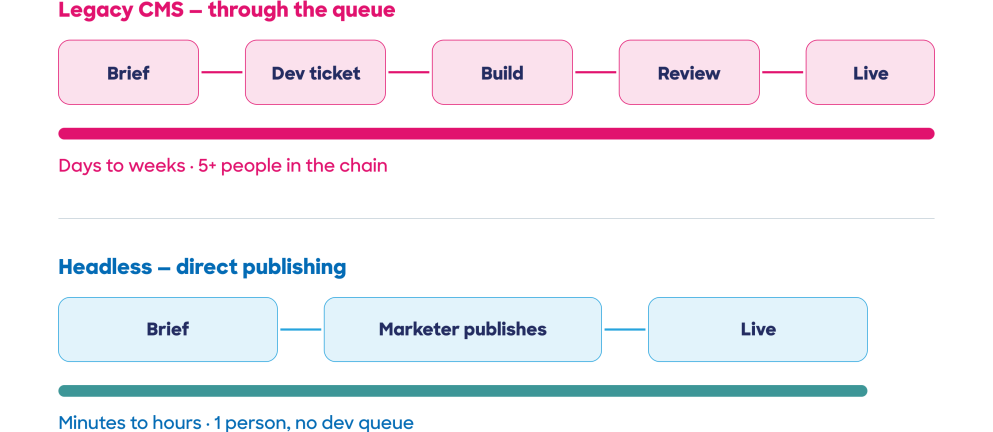
Legacy CMS platforms tightly couple content and presentation, which means any change to layout, structure, or page configuration requires a developer to touch it. Marketing teams adapt, working around the queue, keeping templates static longer than they should, and spinning up campaign microsites on ungoverned tools because it's faster than waiting. Each workaround feels like a small efficiency. Collectively, they represent brand risk, governance risk, and a compounding gap between what the campaign needed and what went live.
The metric that matters here isn't how good the marketing team is at Jira. It's campaign velocity: the elapsed time between a campaign brief and a live campaign page, and the number of people in that chain. According to Gartner's 2024 Channel Campaign Management Survey, 87% of marketers experienced issues with campaign performance in the past 12 months, and with a 31% year-over-year increase in campaign volume, the margin for operational friction is shrinking. A publishing pipeline that runs through a developer queue is friction the business can't afford.
Modern headless CMS architecture decouples content from presentation. It gives marketing teams and content editors the ability to create once and publish everywhere, while still allowing developers the freedom to create experiences using the frontend framework that best supports the customer experience.
Diagnostic question: How long does it take from a campaign brief to a live campaign page, and how many people are in that chain?
Does your organization have a complete inventory of every web property you're responsible for?
This one tends to produce an uncomfortable silence.
Most enterprise organizations have a primary website they know well. They also have a collection of properties they've partially lost track of: department microsites, event pages, campaign landing pages, program sites built by agencies two years ago that are still technically live, regional sites running on different platforms with different CMS credentials, and a handful of properties where nobody is entirely sure who owns the domain renewal.
Each of those properties carries brand exposure. Each carries compliance exposure, e.g., WCAG and ADA requirements, data privacy obligations and cookie consent requirements that vary by jurisdiction. Each carries security exposure. And each represents a vendor relationship, a hosting cost, and an integration that may or may not be documented anywhere.
Web governance sprawl is one of the most underestimated enterprise CMS hidden costs in digital operations, and one of the least likely to appear in any budget conversation until it becomes a crisis. The organizations that discover their full scope usually do so because their CISO asked a question or because something went wrong first. According to IBM's annual Cost of Data Breach report, one in five organizations has experienced a cyberattack tied to ungoverned shadow technology, with those breaches costing an average of $670,000 more than incidents at organizations with tighter controls. Ungoverned web properties are exactly that kind of exposure.
Diagnostic question: If your CISO asked for a complete inventory of all web properties associated with your organization today, how long would it take to produce it?
How many tools does it take to get a piece of content from brief to published?
Count them honestly, including:
- The tool where briefs live
- The tool where marketers create assets
- The DAM where those assets are stored
- The CMS where creators assemble content
- The optimization layer where you measure performance
- The analytics platform where results are reported
Now count the integrations between them, including who built them, who maintains them, and what happens when one of them breaks.
Most enterprise content stacks didn't get this complicated on purpose. They grew by accumulation, one tool added per need, each addition solving a specific problem while creating new dependencies. The scale of that accumulation is striking: as reported by ChiefMartec, the average large enterprise runs 664 applications; more than twice the 255 apps typical of mid-market organizations. Even small businesses average 172. Not all of those are content tools, but the pattern holds: stacks grow, and the coordination cost grows with them.
The question isn't whether each tool earns its place individually. It's whether the coordination costs of running them together are worth what you'd pay for a platform that didn't require them.
Diagnostic question: How many separate tools does your team touch to take a piece of content from brief to live? And who owns the integrations between them?
Is your content infrastructure getting simpler or more complicated over time?
Every platform upgrade, new channel requirement, and organizational change is a test. Does it resolve complexity or add to it?
For organizations on platforms built for a simpler operating reality, the answer is almost always: adds to it. Each upgrade introduces new dependencies. Each new channel (a new AI search integration, regional market, or accessibility requirement) adds a layer. The team adapts, documents a workaround, or absorbs the overhead, and the gap between what the infrastructure supports and what the business now requires widens.
CMS technical debt symptoms rarely announce themselves. They accumulate in delayed releases, normalized workarounds, and integration failures that get absorbed rather than addressed. And like financial debt, it compounds: slowly, then suddenly. Organizations that eventually calculate CMS platform switching costs are often surprised to find they're lower than the ongoing cost of staying. McKinsey research found that CIOs estimate that 10–20% of their technology budget earmarked for new products is diverted to resolving technical debt, and 60% say that debt has increased materially over the past three years. For content infrastructure, the mechanism is the same: every upgrade cycle that adds complexity rather than resolving it is another payment on a growing bill.
Diagnostic question: When you added your last major tool or integration, did it reduce complexity elsewhere in the stack, or did it add a new dependency?
How to calculate what your CMS is really costing you
These five signs aren't independent problems. They're symptoms of the same underlying condition: a platform built for a simpler operational reality that hasn't kept pace with the business's current requirements.
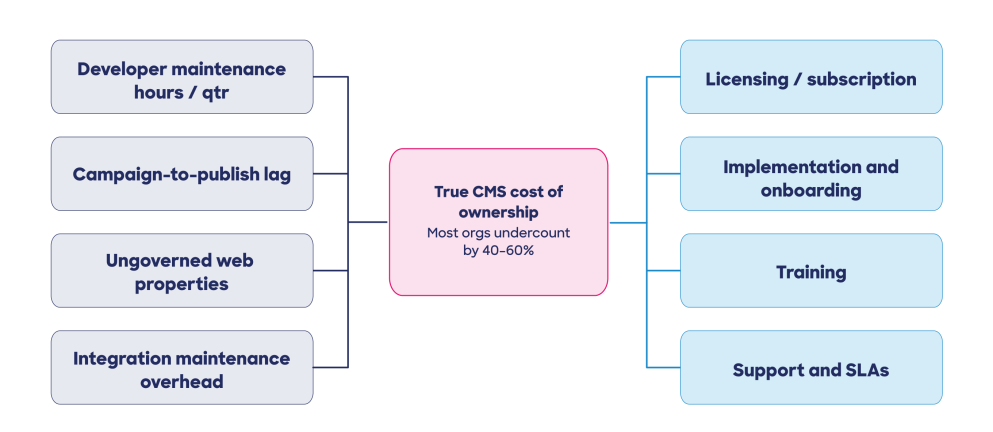
The maintenance tax is real, but it only becomes visible when you look for it. Building a CMS total cost of ownership case starts with four inputs:
- Developer hours per quarter spent on CMS maintenance
- Average campaign-to-publish lag
- Number of ungoverned web properties and associated compliance risk
- Integration maintenance overhead across your content stack
Those four numbers, honestly calculated, are the foundation for building a CMS TCO business case that gives both your marketing and engineering leadership a shared framework for the conversation they need to have.
A unified environment
Acquia Source is built for organizations that have had that conversation where the status quo stops being acceptable and the team commits to working differently. For organizations that recognize that competing going forward means changing what they're working with, Acquia Source becomes the command center that gives marketing teams the publishing independence they need without removing the governance architecture engineering teams require. It replaces the coordination overhead of a sprawling tool stack with a unified environment where content, assets, governance, and AI work together. With built-in AI agents like the Writing Assistant, Site Builder, and the ability to create custom agents for specific tasks and workflows, marketers and content teams can partner with the digital teammates they need to create, publish, and optimize content at scale.
If you're ready to calculate what your current stack is actually costing, get a demo, and we'll walk you through the TCO case.


